Last Updated: 2025-01-31 19:20:36
Curator Announces New Integration with ThoughtSpot
Justin Lyons
Experience Engineer
April 26, 2022
What’s a burglar’s favorite dance move? The running man! What’s a clock’s favorite herb? Thyme! What’s an analyst’s favorite way to bring together their reports from multiple tools? Curator! Apologies for the dad jokes. No apology for letting you know how cool Curator is!
Curator is continuing to grow into an essential tool in the enterprise analytics stack. Every month, we’re adding more no-code options for bringing together your reports in a beautiful website that your users want to visit. We’re also adding platforms that you can connect to for pulling those reports. We have Tableau, Power BI and now … drumroll, please … ThoughtSpot!

Get to Know ThoughtSpot
What is ThoughtSpot, you ask? Well, they say it best on their website: “ThoughtSpot is a business intelligence and big data analytics platform that helps you explore, analyze and share real-time business analytics data easily.” It’s becoming a major platform analysts are choosing for their business intelligence. It’s one of the powerful tools analysts can pair with existing solutions, like Tableau or Power BI, to further enhance the utility of their data.
Adding ThoughtSpot content to Curator is just as easy as adding content from Tableau! Let’s add a Liveboard as an example:
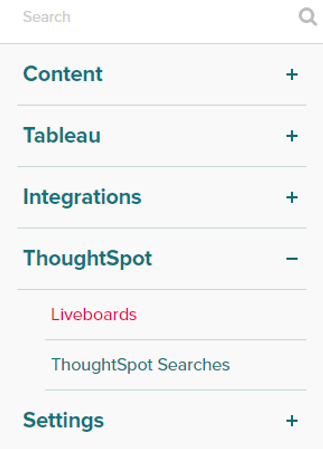
- Once you’ve configured your connection to ThoughtSpot, you’ll see a new menu appear on the left side of your Curator backend admin area:

- Select Liveboards beneath the ThoughtSpot menu and click NewLiveboard on the resulting page:

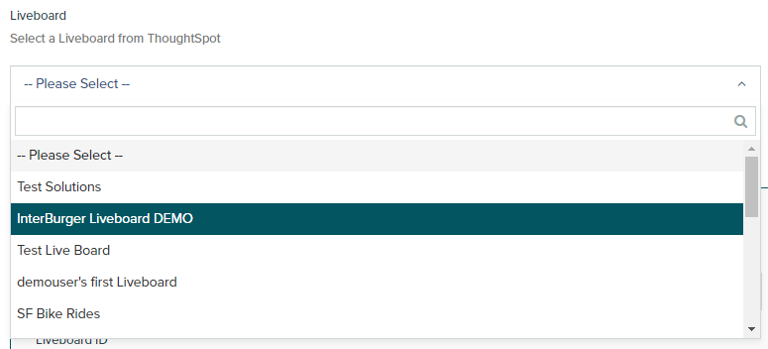
- Select a Liveboard from the automatically populated list retrieved from your ThoughtSpot instance:

- The fields below will automatically be filled with the relevant information, but feel free to change the title or slug (I wouldn’t change the Liveboard ID or things won’t work as expected, but maybe you woke up today and chose chaos!).
- Hit Create on the top-right corner of the page and you’re done!

More Integrations for More Convenience
Now you can add the liveboard to your navigation and users will be able to view it in Curator! And don’t worry, Curator will ask ThoughtSpot what users have permission to view the content, so Craig can only see what he’s supposed to. Why is it always Craig?
The integration with Curator will continue to grow as ThoughtSpot adds features to their embedding APIs, just like with our other integrations. We might even build some custom Curator actions that allow your integrations to play together on a single Page or in a single Report Builder presentation!
If you’re interested in bringing your reporting stack together in one beautiful site that users love to visit, feel free to reach out to us!

Managing a self-hosted web platform can be time-consuming, costly, and complex. If you’re currently self-hosting Curator, migrating to our SaaS platform can unlock a world of advantages designed to make your analytics experience seamless and hassle-free, freeing your team to create further impact on your business.

Recently, Tableau has been encouraging the use of connected apps for external applications, instead of using trusted tickets. All of Tableau’s recent embedding features require connected apps. Since this only deals with behind the scenes authentication, there is no impact to the end user. In our effort to remain closely aligned with Tableau, Curator is transitioning to only using connected apps.

Curator has added the feature to be able to send mark commenting data to a webhook. With the widespread use of API integration platforms, this really opens the doorway to virtually unlimited use cases.
