Last Updated: 2025-01-31 19:20:26
Webinar Replay: Tableau Trailers & Design Teasers
InterWorks
May 5, 2021
Curator was launched in 2016, and over the years, we’ve supported numerous clients with embedding analytics. But what does that really mean, and what does it look like in practice?
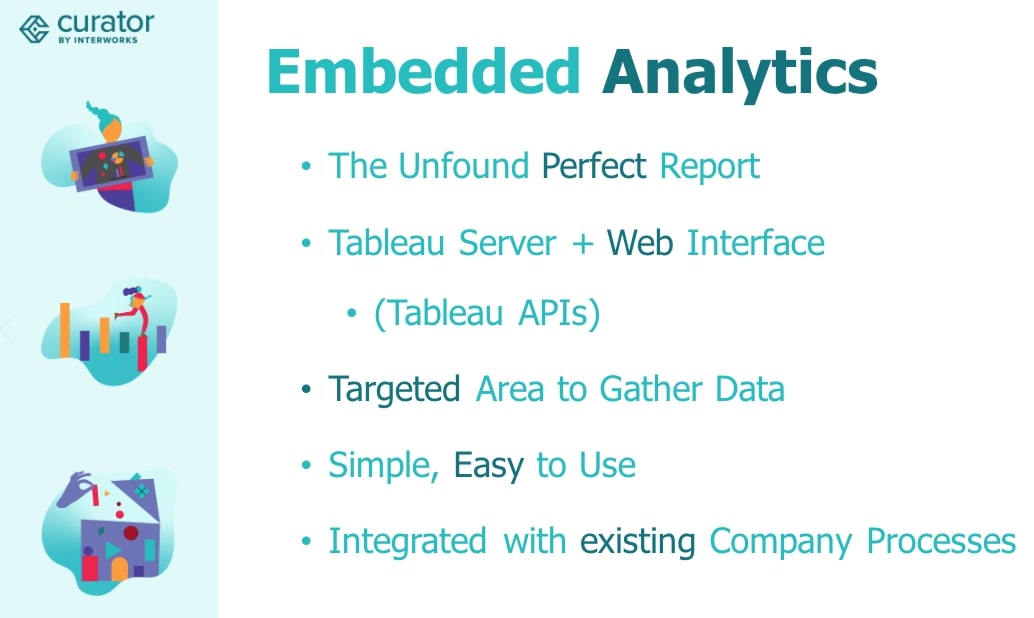
The Power of Embedded Analytics
Embedded analytics is about one goal: showcasing the insights and reports you pour your blood, sweat and tears into. It’s a problem if these reports can’t be seen or shared easily with the end users who need them, not to mention very disheartening for you as the developer. Embedded analytics helps you bridge the gap between that perfect report you’ve created and the audience who needs to see it most.
Curator makes this happen by taking your user interface and combining it with Tableau Server using Tableau APIs. This allows us to create a centralized place for your users to gather and engage with data, and this area stays within your organizational ecosystem and maintains your company branding and privacy policies.
How do you know if embedded analytics is right for your organization? Here are a couple of of things to consider:
- Is your organization using Tableau to its fullest potential? Likely, the answer is no, and we want to help you make the most out of that large investment of time and money. Often, the reason for this is a lack of adoption.
- Are your users finding and consuming your dashboards? Again, often the answer is no. This is a huge issue. Maybe your users are too busy, and your dashboards get lost in the shuffle of other business that needs to be taken care of. Maybe your users can find the dashboards, but the navigation is too clunky and confusing for them to really interact with it.
- A good dashboard isn’t enough. "Build it and they will come" is rarely the way things work when it comes to data visualization. You also need to provide an enjoyable and seamless experience for your users, so they can find and use the dashboards easily.
So what does embedded analytics really look like? How have we seen its implementation? How have we seen it executed effectively? Here are a few use cases and Curator features that have helped increase visibility to data insights.
Branding
One way Curator helps you boost visibility and user engagement is through incorporating strong branding elements in your dashboards. Giving your data a place to live gives it a brand. Brands establish trust and create consistency. Your audience has lots of other brands and businesses competing for their attention, and you want to be sure you get their attention by offering them a personal, premium experience. Appeal to their data-driven minds but also their aesthetic-driven minds; give them a memorable experience.
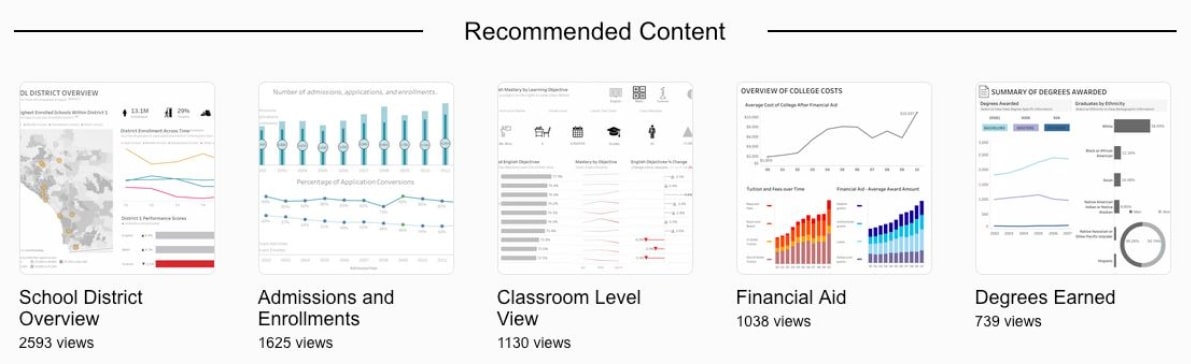
Recommended Content
Another way Curator helps you get more eyes on your hard work is by showing recommended content below the dashboard a user may currently be viewing. With this functionality, you can recommend dashboards and other views to them based on their browsing history. In this way, you can surface the most relevant content to your users without disrupting the flow of their insight-viewing experience. This eliminates extra work they’d have to put in to navigate from dashboard to dashboard and allows you to meet them exactly where they’re at in terms of content they’d like to access.
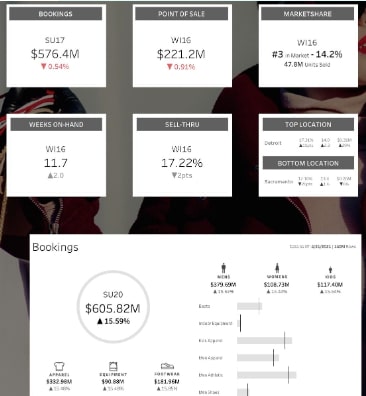
Scorecards
Depending on your audience, you may need to provide high-level metrics quickly and clearly. Scorecards are a great way to surface these insights and takeaways, making it an especially valuable tool for executive audiences. You’re still able to look at a dashboard below the scorecards, enabling you to drill down into more specifics or see certain insights in the context of the broader picture. This is also a great feature if you find yourself running out of room on your dashboards and is a creative way you can combine high-level and more granular details.
Writeback
Also known as our Data Manager feature, the writeback feature allows users who are unfamiliar with the backend processes of Tableau to do some what-if scenario planning and get immediate feedback. They can simply fill out a form and interact with data through a user-friendly interface. In this way, they can still enjoy the feature-rich experience of database options, even without the technical know-how of a developer.
Those are some of the broad ways Curator helps to increase traffic to and engagement with your dashboards. Let's take a look at some specific examples of how we've seen customers experience success with Curator and its features.
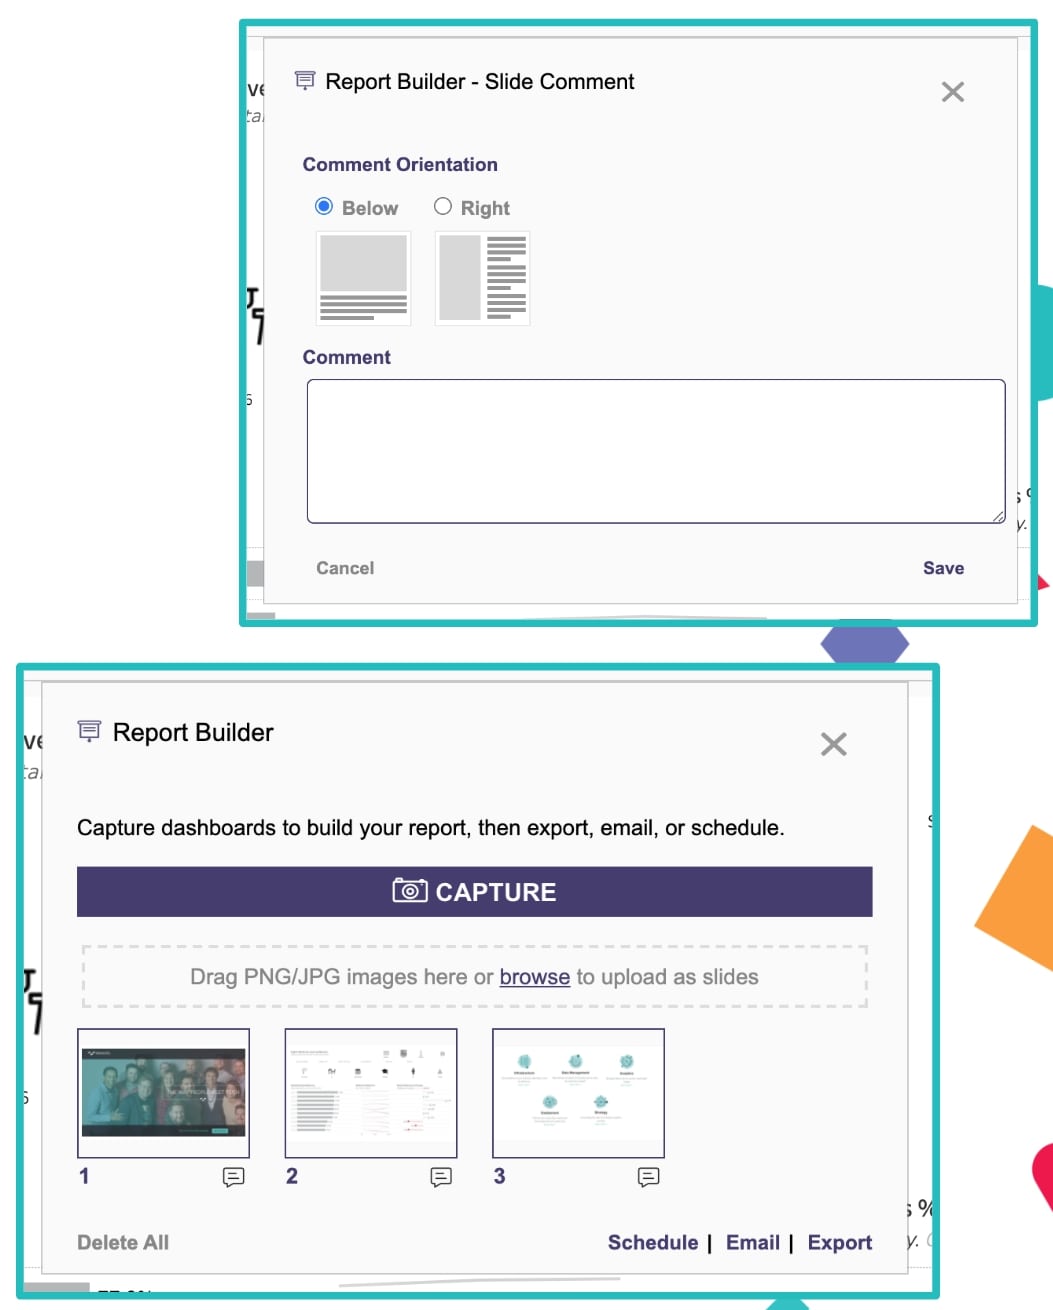
Trailer 1: Report Builder
Challenge: Repetitive reporting tasks
A user spends several hours every week putting together a PowerPoint report to share out with the organization. What began as a simple task with one slide soon gained so much popularity, it has now snowballed into a huge time suck and looks likely to increase in time and effort required.
Solution: Report Builder
This user was able to bring the task into his Curator instance, turn on Report Builder and then train others on how to interact with it. Now, sharing these insights is an automated, repeatable and easily tweaked task. The user doesn’t have to start from scratch every time and can incorporate the company branding in the template.
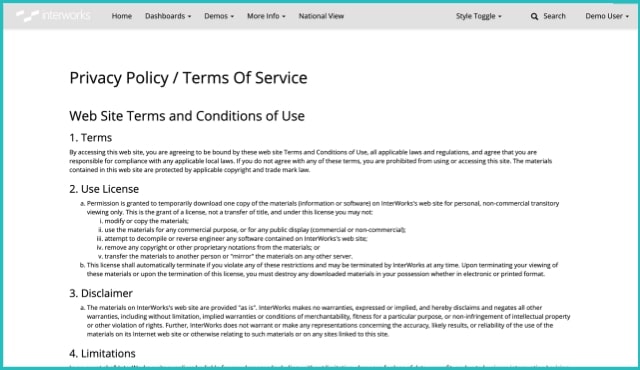
Trailer 2: Terms of Service
Challenge: Legal requirements
It’s important to include relevant legal information and maintain privacy for users viewing your data. However, it’s difficult and time consuming for individuals to have to rewrite, update, paraphrase or otherwise adjust tricky legal language – not to mention all of the extra paperwork required.
Solution: Terms of Service
This is a simple fix by turning on the Terms of Service feature in Curator. With this feature activated, admins can require users to accept certain terms before gaining access to the system. It’s fully automated, and users who have accepted the terms or not can be tracked easily.
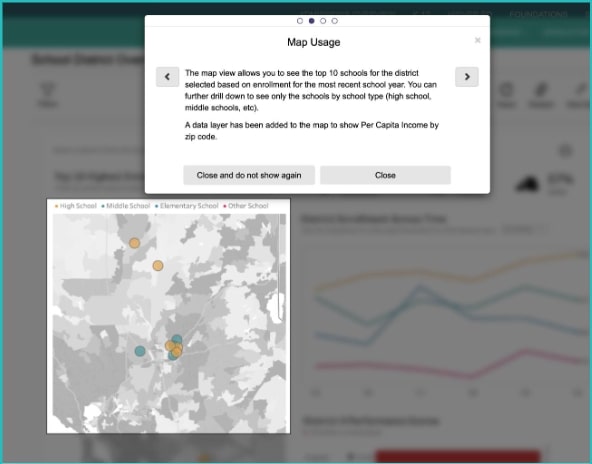
Trailer 3: Guided Tutorials
Challenge: Confused users
An analyst in the pharmaceuticals industry had to put together dashboards featuring advanced and complicated KPIs. The problem is that these KPIs confused the users viewing the dashboards. Not only did they struggle to interpret the data correctly, but they also had a hard time navigating the dashboards.
Solution: Guided Tutorials
Each time the dashboard is loaded, tutorials and other helpful visuals appear that can inform users about filters, KPIs, defined terms, etc. Videos, screenshots and other training content can be provided to enhance user understanding and clarify dashboard use. The tutorials can also be hidden once viewed and are able to be viewed again if needed.
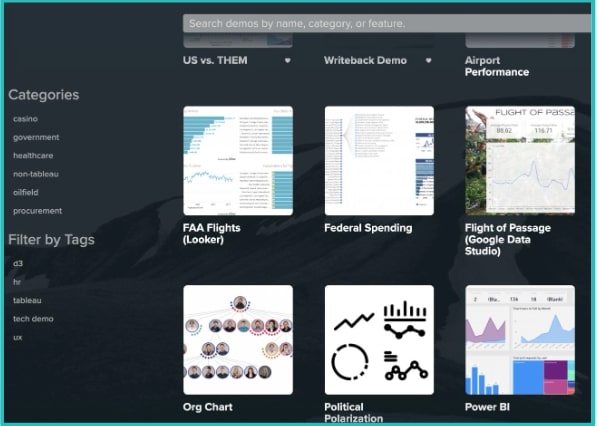
Trailer 4: Portal Content Management
Challenge: Legacy systems
A developer has spent years working on solutions in a legacy system, like Cognos, and shares information with others in the company from this system. Now the company is transitioning to a new platform, Tableau, but the methods and processes required to deliver these insights to others are directly tied to the old system. This individual needs a place where everything can be joined together, so her processes aren't completely scrapped and data lost.
Solution: Portal content management
With a portal solution like Curator, users can bring content from disparate sources together in a centralized place. This allows for embedding content from other reporting platforms alongside Tableau, uploading PowerPoint and Excel files tied to the legacy system and creating extra resources like FAQ and Data Dictionary pages and even training videos.
Unlock the Value of Curator
If your users are continually looking for dashboards, trying to track down insights or being underwhelmed by your current visual analytics, Curator is the solution for you. It will empower you with more control over your data experience, more customization to create reports wrapped in your branding and more flexibility to deliver targeted insights to users, all while holding their interest and keeping them informed.
If you’re curious about Curator and want to see a custom demo, reach out to our team! We’d love to help you get set up with a solution that will take your analytics to the next level. If you’re already a Curator customer and have some new ideas after checking out these common challenges, let us know! We’re always looking for ways to improve the product. In fact, many of the new features we’ve rolled out over the years began as client requests, and we’d love to collaborate with you to make Curator the best it can be.
Check out the webinar recording below:

Managing a self-hosted web platform can be time-consuming, costly, and complex. If you’re currently self-hosting Curator, migrating to our SaaS platform can unlock a world of advantages designed to make your analytics experience seamless and hassle-free, freeing your team to create further impact on your business.

Recently, Tableau has been encouraging the use of connected apps for external applications, instead of using trusted tickets. All of Tableau’s recent embedding features require connected apps. Since this only deals with behind the scenes authentication, there is no impact to the end user. In our effort to remain closely aligned with Tableau, Curator is transitioning to only using connected apps.

Curator has added the feature to be able to send mark commenting data to a webhook. With the widespread use of API integration platforms, this really opens the doorway to virtually unlimited use cases.